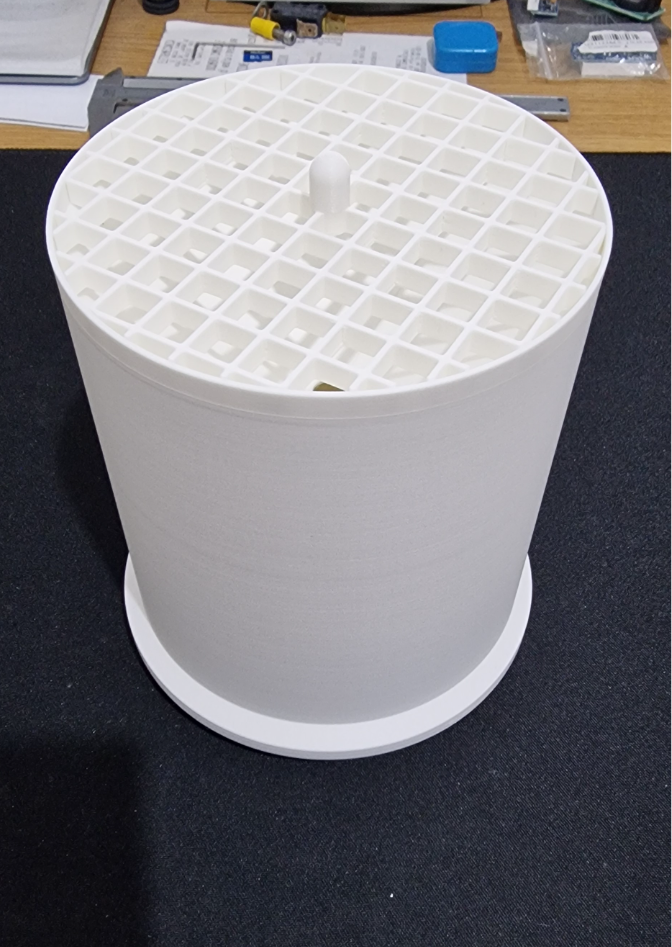
About this 3D model
I created a 3D model of a rain gauge to integrate into Home Assistant using an Aqara Zigbee door and window sensor, similar to what I saw in a YouTube video Calibration First, you need to mount the sensor's magnet in position. Then, using a syringe, empty exactly 5ml of water into one tipping bucket. Use the opposite screw to adjust it so that it tips over only with 5ml of water. Afterward, repeat the same procedure for the other tipping bucket. I recommend performing multiple calibration tests to make everything more precise Formula for calculating mm of rain The calculation is derived by knowing the area of the cup ( A = π x r² = 3.1416 x 2893.44 = 9090.031104 ) and knowing that one tipping bucket contains 5ml ( 5ml = 5000mm³ ) we can find the water column with the formula ( V = A x h ) We know h in mm³ ( 5000mm³ ) and also the area ( 9090.031104 ) So the formula is: h = V / A= 5000mm³ / 9090.031104= 0.550053 This value represents the mm of rain recorded with each tip of the rain gauge's tipping bucket At this link, you will find explanations on how to configure it in Home Assistant https://smartsolutions4home.com/ss4h-zrg-zigbee-rain-gauge/ Packages for Home Assistant I created this file by including it in packages without creating confusion in the configuration.yaml file. Just include the packages: homeassistant: packages: !include_dir_named packages and then create a new folder renamed packages Inside it, create a new file renamed pluviometro.yaml and inside it insert this code: sensor: - platform: history_stats name: "sensore_pioggia_on" entity_id: binary_sensor.pluviometro_contact state: "on" type: count start: "{{ now() - timedelta(hours=24) }}" end: "{{ now() }}" - platform: history_stats name: "sensore_pioggia_off" entity_id: binary_sensor.pluviometro_contact state: "off" type: count start: "{{ now() - timedelta(hours=24) }}" end: "{{ now() }}" - platform: template sensors: sensore_pioggia_aqara: friendly_name: "Aqara Rain Sensor" unit_of_measurement: "mm" value_template: > {% set count_on = states('sensor.sensore_pioggia_on') | int(0) %} {% set count_off = states('sensor.sensore_pioggia_off') | int(0) %} {% set count = count_on + count_off - 1 %} {% set mm = count * 0.550053 %} {{ mm | round(1, 'floor') }} Update I modified the operating logic of the rain gauge so that at the end of the day, it automatically resets at midnight every day, and with a monthly graph, I see the daily values read. If desired, you can modify the data duration of the graphic card by changing hours_to_show: 744 which corresponds to 31 days This is the new Packages and graphic card Packages automation: - alias: Reset rain count at midnight trigger: platform: time at: "00:00:00" action: - service: input_number.set_value target: entity_id: input_number.contatore_pioggia_on data: value: 0 - service: input_number.set_value target: entity_id: input_number.contatore_pioggia_off data: value: 0 input_number: contatore_pioggia_on: name: Rain Counter On initial: 0 min: 0 max: 1000 step: 1 contatore_pioggia_off: name: Rain Counter Off initial: 0 min: 0 max: 1000 step: 1 sensor: - platform: history_stats name: "Rain Sensor On" entity_id: binary_sensor.pluviometro_contact state: "on" type: count start: "{{ now().replace(hour=0, minute=0, second=0, microsecond=0) }}" end: "{{ now() }}" - platform: history_stats name: "Rain Sensor Off" entity_id: binary_sensor.pluviometro_contact state: "off" type: count start: "{{ now().replace(hour=0, minute=0, second=0, microsecond=0) }}" end: "{{ now() }}" - platform: template sensors: sensore_pioggia_aqara: friendly_name: "Aqara Rain Sensor" unit_of_measurement: "mm" value_template: > {% set count_on = states('sensor.sensore_pioggia_on') | int(0) %} {% set count_off = states('sensor.sensore_pioggia_off') | int(0) %} {% set count = count_on + count_off - 1 %} {% set mm = count * 0.550053 %} {{ mm | round(1, 'floor') }} Mini graph card type: custom:mini-graph-card icon: mdi:weather-rainy name: Precipitation aggregate_func: max hours_to_show: 744 group_by: date show: graph: bar fill: true icon: false color_thresholds: - value: 12 color: "#030ffc" - value: 7 color: "#353ffc" - value: 5 color: "#656dfc" - value: 3 color: "#979dfc" - value: 1 color: "#afb3fa" - value: 0 color: "#ffffff" entities: - entity: sensor.sensore_pioggia_aqara_2 state_adaptive_color: false Hovering over it, you can read the graph data Boost Me Give me a boost if you like my rain gauge I currently printed it in Polymaker white PLA to check if everything is okay. I plan to re-print the top cover and the grid in white ASA later, as they will be exposed to the elements all year round The base is printed with 30% infill and 3 wall loops to give it overall robustness, while the rest only requires 15% infill and 2 wall loops. The only supports used are to support the parts that create the interlocking closure between the base and the top cover Free Project: This is a completely free project, but if you feel the need to support me, you ca